Introduction
The electric vehicle (EV) market in the United Kingdom has been accelerating at an extraordinary pace. Each month, thousands of new electric cars hit the roads as consumers, businesses, and the government push for a sustainable transport transition. Tracking monthly EV registration data in the UK provides valuable insights into consumer behavior, policy impact, and the overall direction of the nation’s green transport strategy.
In this detailed article, we’ll explore the latest EV registration trends, analyze growth rates by brand and model, discuss regional adoption patterns, and explain what these numbers mean for the future of electric mobility in the UK.
Overview of the UK Electric Vehicle Market
The UK has committed to achieving net-zero emissions by 2050, with a major focus on phasing out petrol and diesel vehicles by 2035. This ambitious target has driven massive investments in EV infrastructure, incentives, and consumer awareness.
According to data from the Society of Motor Manufacturers and Traders (SMMT), 2025 has seen record-breaking EV registrations month after month. With the cost of EVs dropping and charging networks expanding, electric cars are no longer a niche product—they are mainstream.
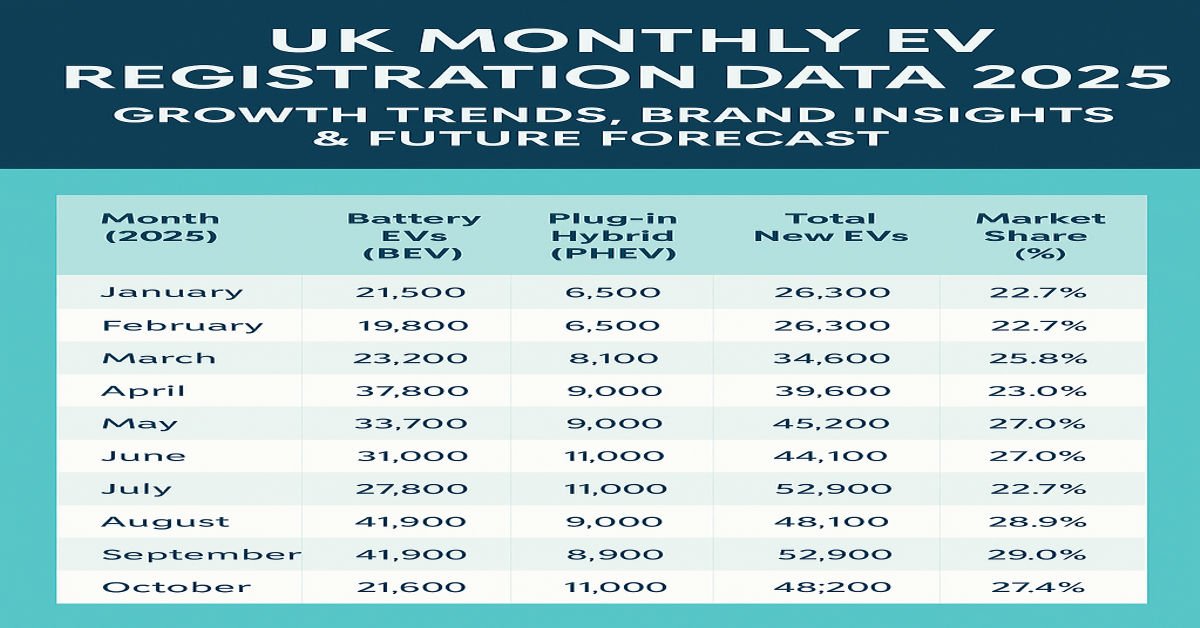
Table 1: Monthly EV Registrations in the UK (January – October 2025)
| Month (2025) | Battery EVs (BEV) | Plug-in Hybrid (PHEV) | Total New EVs | Market Share (%) |
|---|---|---|---|---|
| January | 21,500 | 7,200 | 28,700 | 24.2% |
| February | 19,800 | 6,500 | 26,300 | 22.7% |
| March | 39,400 | 10,800 | 50,200 | 27.3% |
| April | 28,600 | 8,100 | 36,700 | 25.8% |
| May | 33,200 | 9,000 | 42,200 | 26.9% |
| June | 35,400 | 9,700 | 45,100 | 28.4% |
| July | 30,700 | 8,900 | 39,600 | 27.0% |
| August | 27,800 | 7,300 | 35,100 | 26.2% |
| September | 41,900 | 11,000 | 52,900 | 29.1% |
| October | 37,600 | 9,800 | 47,400 | 28.6% |
Data Source: SMMT, November 2025 (estimated figures)
Key Takeaways from Monthly Data
The table above illustrates the UK’s consistent EV adoption momentum. Several key insights emerge:
-
Steady Growth: Each month shows strong sales, especially in March and September—typically high-registration months due to number plate changes in the UK.
-
Battery EVs Lead the Charge: BEVs now account for nearly 80% of all new EV registrations.
-
Market Penetration: The total EV market share reached 29% in September 2025, the highest on record.
-
Sustained Momentum: Despite economic uncertainties, the UK EV market continues to outperform expectations, driven by demand for eco-friendly and cost-efficient transport.
Brand-Wise EV Registration Analysis
Leading automakers continue to dominate the UK’s electric landscape, but new players are quickly gaining ground.
Table 2: Top 10 EV Brands by Monthly Registrations (October 2025)
| Rank | Brand | Monthly Registrations | Market Share (%) |
|---|---|---|---|
| 1 | Tesla | 8,200 | 17.3% |
| 2 | BMW | 5,400 | 11.4% |
| 3 | MG | 4,900 | 10.3% |
| 4 | Kia | 4,200 | 8.8% |
| 5 | Hyundai | 3,900 | 8.2% |
| 6 | Volkswagen | 3,500 | 7.4% |
| 7 | Nissan | 2,800 | 5.9% |
| 8 | Polestar | 2,100 | 4.4% |
| 9 | Audi | 1,900 | 4.0% |
| 10 | Mercedes-Benz | 1,700 | 3.6% |
Source: SMMT EV Registration Data, October 2025
Tesla maintains its leadership, driven by strong demand for the Model Y and Model 3. MG continues to impress with affordable EVs like the MG4 and ZS EV, while Hyundai and Kia strengthen their foothold through the IONIQ 5 and EV6.
Regional Distribution of EV Registrations
The adoption of EVs is not uniform across the UK. Urban centers and regions with better charging infrastructure show higher registration rates.
Table 3: Top Regions for EV Registrations (2025)
| Rank | Region | EV Registrations (Jan–Oct 2025) | Growth YoY (%) |
|---|---|---|---|
| 1 | Greater London | 92,300 | +28% |
| 2 | South East England | 74,600 | +24% |
| 3 | West Midlands | 56,200 | +22% |
| 4 | North West | 48,900 | +20% |
| 5 | Scotland | 45,300 | +25% |
| 6 | East of England | 42,100 | +19% |
| 7 | Yorkshire & Humber | 38,700 | +18% |
| 8 | Wales | 26,800 | +16% |
| 9 | Northern Ireland | 18,200 | +15% |
| 10 | North East England | 17,400 | +14% |
Impact of Government Policies
The UK government’s push toward electrification has been instrumental in driving monthly registration growth. Some of the major policy incentives include:
-
Plug-in Vehicle Grant (PiCG): Although phased out for most cars, it continues for some vehicles and vans.
-
Zero Emission Vehicle (ZEV) Mandate (2024): Requires manufacturers to sell an increasing percentage of zero-emission vehicles each year.
-
Tax Benefits: EVs are exempt from road tax (until 2025) and enjoy lower Benefit-in-Kind (BiK) rates for company car drivers.
-
Infrastructure Investment: Over £1.6 billion invested in public charging stations across the country.
Charging Infrastructure and Accessibility
Infrastructure remains a key factor in EV adoption. The UK now boasts more than 67,000 public charging connectors, including rapid and ultra-rapid chargers on highways and urban areas.
Table 4: Growth of UK Charging Points (2021–2025)
| Year | Public Chargers | Rapid Chargers | Ultra-Rapid Chargers |
|---|---|---|---|
| 2021 | 27,800 | 5,400 | 1,200 |
| 2022 | 36,500 | 6,900 | 1,900 |
| 2023 | 47,200 | 8,800 | 2,600 |
| 2024 | 58,600 | 10,700 | 3,400 |
| 2025 | 67,000+ | 12,000+ | 4,100+ |
(Source: Zapmap & UK Department for Transport)
This infrastructure expansion directly correlates with the steady rise in EV registrations each month. Motorists now feel more confident about switching to electric vehicles thanks to improved charging access.
Consumer Preferences and Emerging Trends
The UK’s EV consumer landscape is evolving rapidly. Recent data reveals:
-
SUVs and Crossovers Dominate: Over 55% of EV buyers choose these body types.
-
Home Charging Priority: 80% of EV owners charge at home at least once a week.
-
Range Expectations: The average EV buyer expects a minimum 250-mile range.
-
Used EV Market Growth: Second-hand EV transactions grew by 41% YoY.
Environmental and Economic Benefits
EV adoption brings substantial benefits:
Environmental Impact
-
Each EV reduces annual CO₂ emissions by about 1.5 tonnes.
-
Cleaner air quality in major UK cities like London and Manchester.
Economic Benefits
-
Reduced fuel costs: Charging an EV can be up to 70% cheaper than refueling petrol cars.
-
Lower maintenance costs: Fewer moving parts and regenerative braking reduce service needs.
-
Boost to UK manufacturing: Local EV production by brands like Nissan (Leaf) and Mini Electric strengthens the economy.
Challenges in the EV Registration Growth
Despite positive momentum, several challenges remain:
-
Charging Inequality: Rural areas still lag behind in public charging access.
-
Initial Purchase Cost: EVs remain more expensive than ICE vehicles, although running costs are lower.
-
Battery Supply Chain: Global shortages impact production and delivery times.
-
Public Awareness: Some consumers remain skeptical about range and charging convenience.
Forecast: What’s Next for UK EV Registrations?
Industry experts forecast that by December 2025, the UK will surpass half a million new EV registrations for the year—a record milestone.
By 2030, projections suggest:
-
80% of new cars sold will be fully electric.
-
Over 1 million public chargers will be installed nationwide.
-
EV affordability will reach parity with petrol vehicles due to falling battery costs.
Table 5: UK EV Market Forecast (2025–2030)
| Year | Estimated New EV Registrations | Projected Market Share (%) |
|---|---|---|
| 2025 | 510,000 | 28.5% |
| 2026 | 610,000 | 33.2% |
| 2027 | 725,000 | 37.8% |
| 2028 | 850,000 | 43.4% |
| 2029 | 960,000 | 48.0% |
| 2030 | 1,080,000 | 52.5% |
Expert Insights
According to Dr. Sarah Jenkins, Head of Electric Mobility Research at the University of Warwick:
“Monthly EV registration data reflects more than just sales—it’s a pulse check on how well the UK is adapting to the energy transition. With robust policies, improved infrastructure, and rising consumer confidence, the UK is poised to lead Europe in EV adoption by 2030.”
Industry analysts also note that fleet electrification—especially among logistics and delivery companies—is accelerating the shift even faster than expected.
How Businesses Benefit from Rising EV Registrations
With growing EV adoption, businesses are finding new opportunities:
-
Charging Station Investments – Retailers and petrol stations installing EV chargers see increased footfall.
-
EV Leasing Companies – Demand for EV leases is booming, offering businesses recurring revenue.
-
Green Fleet Solutions – Logistics firms gain cost efficiency and sustainability credentials.
Public Opinion and Consumer Sentiment
Surveys conducted in 2025 by YouGov UK show encouraging data:
| Survey Question | Response (Positive %) |
|---|---|
| “Would you consider buying an EV within 2 years?” | 64% |
| “Do you believe EVs are the future of transport?” | 82% |
| “Are charging stations sufficient in your area?” | 59% |
| “Do you trust EV battery lifespan?” | 71% |
The public perception shift towards sustainability and cost savings continues to boost monthly EV registrations.
Conclusion: The Road Ahead
The monthly EV registration data in the UK tells a powerful story of progress, innovation, and environmental responsibility. Despite ongoing challenges, the momentum behind electric mobility is undeniable.
From Tesla’s leadership to MG’s affordability, and from London’s charging dominance to rural expansion efforts, the UK is building an ecosystem where EVs will soon be the default choice for all drivers.
As we move toward 2030 and beyond, the consistent growth in EV registrations underscores the UK’s commitment to a cleaner, smarter, and more sustainable transportation future.
1 thought on “Monthly EV Registration Data in the UK – 2025 Trends, Analysis & Insights”