Introduction: Why Battery Performance Defines the Future of EVs
Battery Performance and Energy Chart for EVs are transforming the global automotive industry, offering sustainability, efficiency, and advanced technology. At the heart of this revolution lies one critical component — the battery. The battery determines an EV’s range, performance, energy consumption, and lifespan, making it the most vital metric for both manufacturers and consumers.
In this guide, we’ll explore:
-
How EV batteries perform under different conditions
-
Energy efficiency and degradation over time
-
The latest technologies shaping 2025’s EV batteries
-
A comparative energy chart of popular EV models
-
Expert insights to help you choose the best EV for your needs
Understanding EV Battery Basics
EV batteries are rechargeable power storage units that supply energy to the vehicle’s electric motor. The most common type used today is the Lithium-Ion (Li-Ion) battery, known for high energy density and low weight.
Key Components of an EV Battery
| Component | Function | Example Material |
|---|---|---|
| Cathode | Determines energy capacity and voltage | Lithium Nickel Manganese Cobalt Oxide (NMC) |
| Anode | Stores lithium ions during charging | Graphite or Silicon |
| Electrolyte | Transfers lithium ions | Liquid or solid-state electrolyte |
| Separator | Prevents short circuit | Microporous polymer film |
How Battery Performance is Measured
Battery performance depends on multiple parameters. Understanding them helps consumers make informed decisions about efficiency and longevity.
Energy Density (Wh/kg)
This measures how much energy the battery stores per kilogram.
Higher energy density = longer driving range.
| Battery Type | Energy Density (Wh/kg) | Average Range |
|---|---|---|
| Lithium-Ion (NMC) | 250–300 | 400–500 km |
| LFP (Lithium Iron Phosphate) | 160–200 | 300–400 km |
| Solid-State | 350–500 (Emerging) | 600–800 km |
Power Density (W/kg)
Determines how quickly the battery delivers energy.
Higher power density = better acceleration performance.
Efficiency and Energy Loss
Battery efficiency refers to how much stored energy is converted into motion.
EVs generally have 85–90% efficiency, meaning only a small fraction of energy is lost due to heat and resistance.
Cycle Life
Cycle life refers to the number of charge–discharge cycles before the battery capacity drops below 80%.
Typical cycle life: 1,000–2,500 cycles, translating to 8–15 years of usage.
Factors Affecting Battery Performance
Battery performance isn’t static — it fluctuates due to several internal and external factors.
| Factor | Description | Impact |
|---|---|---|
| Temperature | Extreme heat or cold reduces efficiency | Short-term range drop |
| Charging Speed | Fast charging increases heat generation | Slightly reduces lifespan |
| Driving Habits | Aggressive acceleration drains energy faster | Reduced efficiency |
| Load Weight | Heavier vehicles consume more energy | Range reduction |
| Terrain | Hilly routes require more power | Decreased battery endurance |
The Evolution of EV Battery Technology (2020–2025)
EV battery innovation has accelerated dramatically between 2020 and 2025. Let’s explore the most significant advancements:
Lithium Iron Phosphate (LFP) Revival
LFP batteries, once overshadowed by NMC cells, are gaining ground due to:
-
Better thermal stability
-
Longer lifespan
-
Lower production cost
Tesla, BYD, and MG are using LFP batteries for affordable EVs in 2025.
Solid-State Batteries: The Future Standard
Solid-state batteries replace liquid electrolytes with solid materials, offering:
-
2× energy density
-
Faster charging
-
Improved safety
Toyota and QuantumScape are expected to launch commercial solid-state EVs by 2026.
Silicon Anode and Graphene Integration
Adding silicon to anodes can increase energy density by 20–40%.
Graphene layers improve conductivity and reduce charging time.
Battery Management Systems (BMS)
Modern BMS software ensures optimized performance by:
-
Balancing charge across cells
-
Monitoring temperature and voltage
-
Enhancing safety and longevity
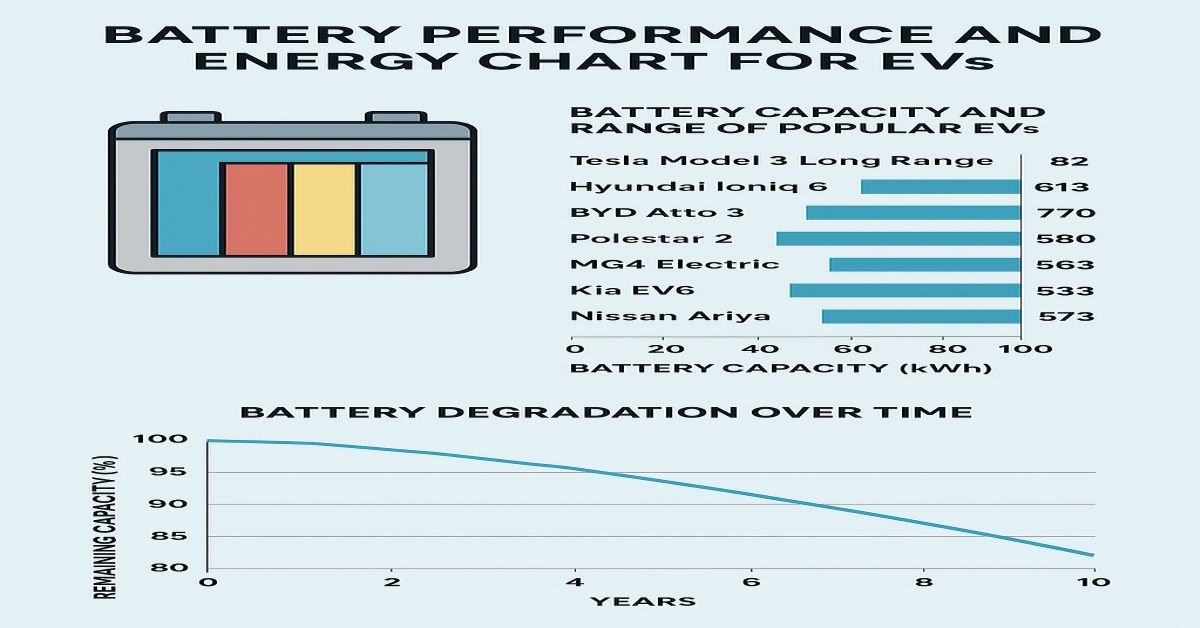
Battery Energy Chart: Top EV Models (2025)
Here’s a comparative energy chart highlighting battery capacity, efficiency, and range for leading EVs available in 2025.
| EV Model (2025) | Battery Capacity (kWh) | Range (WLTP km) | Efficiency (Wh/km) | Charging Time (10–80%) | Battery Type |
|---|---|---|---|---|---|
| Tesla Model 3 Long Range | 82 | 613 | 134 | 25 min | NMC |
| Hyundai Ioniq 6 | 77.4 | 610 | 126 | 27 min | NCM |
| BYD Atto 3 | 60.5 | 420 | 144 | 35 min | LFP |
| Polestar 2 | 82 | 550 | 149 | 28 min | NMC |
| MG4 Electric | 64 | 450 | 142 | 30 min | LFP |
| Kia EV6 | 77.4 | 528 | 146 | 18 min | NCM |
| Nissan Ariya | 87 | 533 | 163 | 35 min | NMC |
Battery Degradation Over Time
Battery degradation is the gradual loss of capacity over the years.
Average Battery Degradation Rate:
-
2–3% per year under normal conditions.
-
After 8 years, the battery may retain around 80% capacity.
Mitigation Tips:
-
Avoid frequent full (100%) charges.
-
Use Level 2 AC charging for daily use.
-
Keep the battery between 20–80% charge.
-
Park in shaded or cool areas.
Energy Consumption Comparison (Real-World Tests)
| EV Model | Highway Efficiency (Wh/km) | City Efficiency (Wh/km) | Combined Efficiency |
|---|---|---|---|
| Tesla Model Y | 152 | 125 | 139 |
| Hyundai Kona Electric | 148 | 118 | 133 |
| BYD Seal | 165 | 130 | 148 |
| Volkswagen ID.4 | 170 | 138 | 154 |
| Polestar 2 | 180 | 145 | 160 |
Observation:
City driving is generally more efficient due to regenerative braking, which recovers energy during deceleration.
The Role of Regenerative Braking
Regenerative braking converts kinetic energy back into electrical energy during braking. This recovered energy recharges the battery and improves range efficiency by 5–10%.
Formula:
Recovered Energy = Kinetic Energy × Regeneration Efficiency
Example: If 100 kJ of kinetic energy is lost during braking and regeneration efficiency is 70%, then 70 kJ is returned to the battery.
Environmental and Economic Impacts of Efficient Batteries
Environmental Impact
-
Reduced carbon footprint
-
Lower dependence on fossil fuels
-
Easier recycling with modern materials (e.g., cobalt-free batteries)
Economic Impact
-
Lower running cost per km (as low as ₹1/km in India or AU$0.03/km in Australia)
-
Reduced maintenance cost due to fewer moving parts
-
Longer lifespan = higher resale value
Battery Recycling and Second-Life Applications
Recycling is crucial to achieving a circular economy. Old EV batteries can be reused or repurposed for:
| Application | Description |
|---|---|
| Home Energy Storage | Retired EV batteries used as backup power |
| Renewable Grid Balancing | Store solar or wind energy |
| Industrial Backup Systems | Provide stable power to factories |
Companies like Redwood Materials, CATL, and LG Energy Solution are leading large-scale EV battery recycling in 2025.
Innovations in Battery Energy Charts and Monitoring
EV dashboards now include real-time energy monitoring, allowing drivers to track:
-
Energy used per km
-
Regenerative energy gained
-
Battery temperature
-
State of Health (SoH)
Mobile apps such as Tesla App, Hyundai BlueLink, and BYD DiLink offer detailed analytics through cloud-based data systems.
Challenges Ahead for Battery Performance
| Challenge | Description | Potential Solution |
|---|---|---|
| Limited Raw Materials | Lithium and nickel scarcity | Sustainable mining, recycling |
| Charging Infrastructure | Uneven charger distribution | Nationwide fast-charging networks |
| High Cost | Battery pack = 30–40% of EV price | Technological scale and government incentives |
Government Standards and Regulations (2025)
Governments are implementing stricter regulations to ensure battery safety and sustainability.
Examples:
-
Australia & EU: Mandatory battery recycling systems
-
U.S. (EPA 2025): Energy efficiency benchmarks for EV manufacturers
-
India (AIS 156): Battery safety certification and thermal management standards
Future Trends in Battery Technology (2025–2030)
a. Sodium-Ion Batteries
-
Cost 30% lower than Li-ion
-
Eco-friendly and stable at low temperatures
-
CATL and BYD already testing prototypes
b. Ultra-Fast Charging (UFC)
-
80% charge in under 10 minutes
-
New silicon anode and graphene tech make this possible
c. AI-Integrated BMS
AI-based systems can predict battery failures, optimize charging cycles, and extend battery life.
Conclusion: Smarter Batteries, Greener Future
EV battery performance defines how far, how fast, and how efficiently you travel. The evolution from lithium-ion to solid-state and AI-integrated systems represents a major leap toward sustainability and convenience.
By understanding battery performance metrics and energy charts, buyers can make more informed decisions and maximize value from their EV investment.
The year 2025 marks a milestone — batteries are not just power sources, but the intelligence centers of the modern electric vehicle.
2 thoughts on “Battery Performance and Energy Chart for EVs (2025 Guide)”